Six ships and a jammed signal: Hormuz goes quiet as oil jumps and gold gives back gains
A single chokepoint recorded six ship transits in 24 hours and a sustained electronic-jamming incident, with gold sliding more than 1% and oil surging on closure fears.
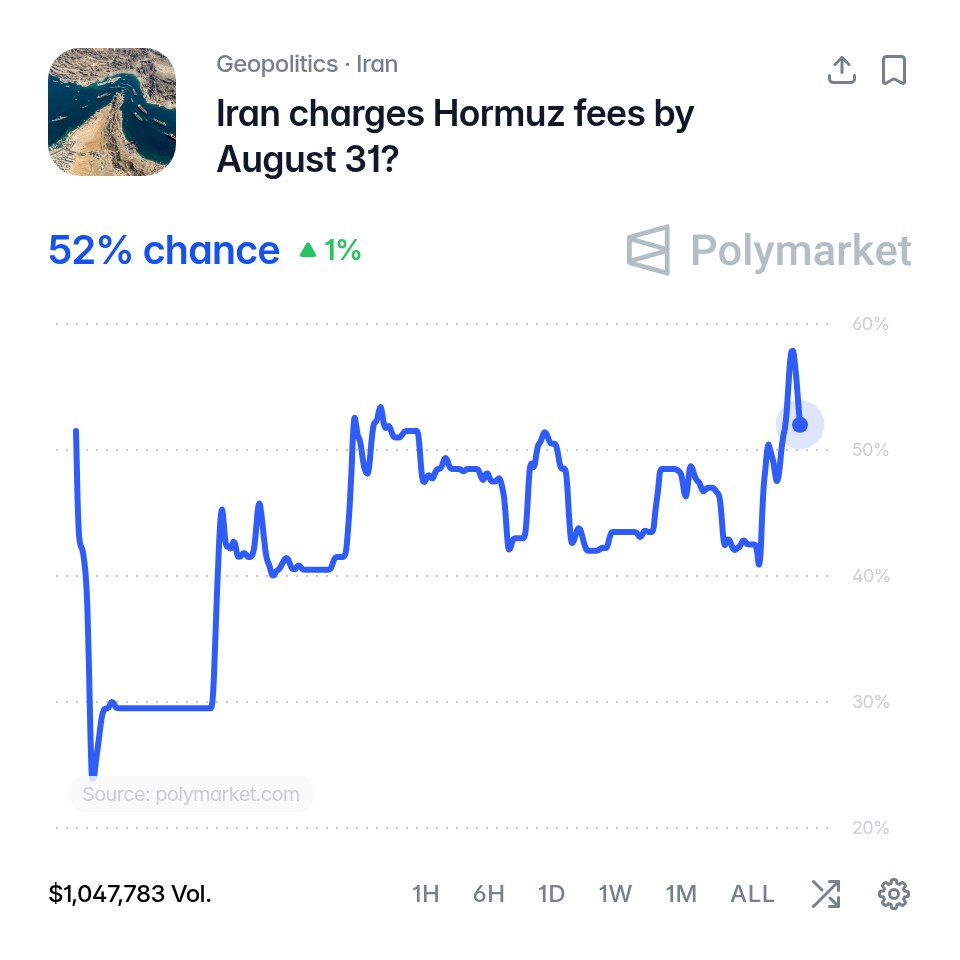
Six commercial vessels transited the Strait of Hormuz in the 24 hours to 2026-07-13 04:53 UTC, according to a Telegram dispatch from the WatcherGuru account, a flow rate that, if sustained, would represent a near-standstill for the waterway that normally carries a sizeable share of seaborne crude. Reporting published by Reuters at 04:30 UTC the same day confirmed that benchmark crude prices pushed higher and that gold slid more than 1% as traders repositioned for a possible closure. By 05:42 UTC, the OSINT channel AMK Mapping was flagging heavy signal jamming inside the strait, an electronic-warfare tell consistent with a militarised perimeter rather than a routine naval exercise.
The simultaneous move, safe haven gold down, risk asset oil up, is the signature of a market repricing tail risk in a single corridor. Until 13 July the assumption embedded in forward curves was that the strait would remain navigable under escort. By the close of the Asian session, that assumption was being unwound.
What the tape is saying
Gold's drop is the more interesting half of the move. When geopolitical risk rises, gold usually rises with it; a sell-off of more than 1% on a closure scare means something else is going on. The most plausible read is a margin call: leveraged long gold positions, built up during months of central-bank buying and dollar-anxiety flows, are being liquidated to meet margin on surging crude and refined-product futures. In other words, gold is not being rejected as a hedge; it is being sold to pay for the hedge on the other side of the book. The Reuters dispatch, timestamped 2026-07-13 04:30 UTC, frames the move as a function of the dollar and US Treasury yields, but the sequencing, gold down while oil and shipping-insurance premia rise, is the classic late-stage risk-event pattern in commodity books.
The shipping data points in the same direction. Six transits in a day is not a slowdown; it is a refusal. WatcherGuru's count, posted at 2026-07-13 04:53 UTC, does not specify vessel class, flag state, or cargo, so it cannot be converted into a barrels-per-day figure from a single post. But the order-of-magnitude implication is severe: normal traffic through Hormuz runs in the dozens of transits per day, with crude flows measured in the millions of barrels. A 24-hour count in single digits means either that commercial operators are pre-emptively diverting around the Cape of Good Hope, adding roughly two weeks of voyage time, or that the count is a snapshot of a window in which transits were physically blocked, not merely avoided.
The electronic layer
The third data point, AMK Mapping's report of heavy signal jamming inside the strait at 2026-07-13 05:42 UTC, is the one with the longest half-life. Jamming of commercial navigation and AIS frequencies is consistent with a state or non-state actor seeking to degrade vessel tracking and complicate coordination among tankers, naval escorts, and port authorities. It does not by itself prove kinetic intent, and AMK Mapping did not attribute the jamming to any party. But combined with the collapse in transit counts, it points to an operating environment in which commercial crews cannot rely on the electronic aids they normally use to thread the 21-mile-wide shipping lanes.
That is a different problem from a blockade. A blockade involves hulls visibly across the channel. A jamming environment involves uncertainty: tankers slow down, insurance premia rise, charterers split cargoes across routes, and the price of a barrel reflects the option value of a route that may or may not be open at any given hour. The market repricing underway on 13 July is consistent with traders beginning to price that option.
The structural frame
The Strait of Hormuz is the most consequential chokepoint in the global energy system, and the global energy system has been quietly re-architecting around it for years. Gulf exporters have built pipeline bypasses to terminals on the Arabian Sea coast; Chinese refiners have diversified crude sources from West Africa and Russia; strategic petroleum reserves across importing Asia have been topped up. None of that substitutes for the strait, but it does mean that a sustained closure would produce a sharp, ugly spike followed by a slower adjustment, rather than the 1970s-style linear shock.
Two features of this episode are unusual. First, the speed of the repricing: gold down more than 1% and oil materially higher on a single morning suggests that at least part of the market was underhedged for this scenario, despite the build-up of bypass infrastructure. Second, the combination of a transit count in single digits with active electronic jamming suggests a coordinated posture rather than a harassment incident, and the sources available to this publication do not identify the actor. The framing of this event in Western wires has so far centred on oil prices and gold flows; the framing in regional and OSINT channels has centred on the operational picture in the water. Both are correct, and neither is complete without the other.
What to watch next
Three signals will determine whether 13 July 2026 is remembered as a one-day scare or the opening of a sustained dislocation. First, transit counts: a return to double-digit daily transits through the strait within 48 hours would imply that the 6-ship day was a tactical pause, not a strategic posture. Second, attribution: the sources do not name a party responsible for the jamming, and that absence is itself a story; a confirmed attribution would let markets price a specific countermeasure and timeline. Third, insurance: war-risk premia for tankers calling at Gulf ports are the most sensitive real-time indicator of carrier expectations, and a move from the current baseline into triple-digit-basis-point territory would confirm that operators are pricing sustained exposure rather than a single bad day.
What remains uncertain, on the evidence available to this publication, is whether the six-ship count reflects physical blockage, commercial avoidance, or a counting-window artefact. The sources do not specify vessel type, flag, or cargo, and they do not provide a baseline against which to compare the 24-hour total. The jamming report is similarly un-attributed. Until those gaps are filled, the prudent read is that the market is pricing a tail it cannot yet size, and the price action on the morning of 13 July 2026 is the tape catching up to a corridor that has, for a few hours at least, stopped behaving like a corridor.
Desk note: Monexus framed the 13 July Hormuz move on the operational data (transit counts, jamming) as the primary signal, with commodity price action as the secondary read. Most wires led with the gold-and-oil tape; we treat that tape as derivative, since the price move is downstream of decisions being made by ship operators and naval authorities in the water itself.
Wire provenance
This editorial synthesis draws on the following public wire/social posts:
- http://reut.rs/4vpEaYk
- https://t.me/WatcherGuru
- https://t.me/AMK_Mapping